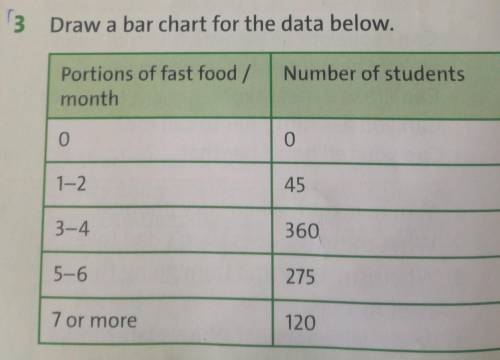
Ex3. Draw a bar chart for the data below.
Number of students
Portions of fast food /
month
0
0
1-2
45
3-4
360
5-6
275
7 or more
120
 vikulek1
3
05.03.2021 13:41
56
vikulek1
3
05.03.2021 13:41
56
Ответы
Показать ответы (3)
Другие вопросы по теме Английский язык
 Penb
08.06.2019 22:20
Penb
08.06.2019 22:20
 Volkov1822
08.06.2019 22:20
Volkov1822
08.06.2019 22:20
 tyy6
08.06.2019 22:20
tyy6
08.06.2019 22:20
 leonleontiev6
08.06.2019 22:10
leonleontiev6
08.06.2019 22:10

 ponchara423
21.12.2020 17:01
ponchara423
21.12.2020 17:01
 sohibjon457
21.12.2020 17:02
sohibjon457
21.12.2020 17:02
 Kamjla1
21.12.2020 17:02
Kamjla1
21.12.2020 17:02
 Shkolnik228007
21.12.2020 17:03
Shkolnik228007
21.12.2020 17:03

Популярные вопросы
- Длина верёвки 27м.отрезали 1/3 её длины.сколько метров верёвки отрезали...
3 - Решите . известно, что родители имеют 2 и 3 группы крови. какова вероятность...
2 - Кого из героев поэмы кому на руси жить хорошо можно назвать праведником?...
1 - 20 почему в слове информационное пишется...
1 - Одна из сторон параллелограмма равна 14см,а высота проведенная к ней 5см....
3 - Иквадрат имеют один и тот же периметр. сторона квадрата 14 см. ширина прямоугольника...
3 - Один из корней уравнения x²+ac+72 равен 9.найдите другой корень и коэффициент...
2 - Іть скласти і записати 2 речення зі словами в 1 речені: глечик,чашка. в 2речені:...
2 - Отгадай загадку в желтом море корабль плывет кто корабль по морю ведет...
3 - Вкаком слове -ин- имеет значения лицо женского пола по названию мужского пола...
2